文章目录
- 🏳️🌈 LegendOpts基本参数
-
- 1. 默认参数实例
- 2. 设置参数实例
- 🏳️🌈 更多设置实例(源码+数据下载)
大家好,我是 👉【Python当打之年(点击跳转)】
今天给大家介绍 pyecharts绘图中常见的图例配置项设置(LegendOpts) ,希望对大家有所帮助,如有疑问或者建议可以私信小编。
🏳️🌈 LegendOpts基本参数
包含:
type_、selected_mode、is_show、pos_left、pos_right、pos_top、pos_bottom、orient、align、padding、item_gap、item_width、item_height、inactive_color、textstyle_opts、legend_icon…
class LegendOpts(
    # 图例的类型。可选值:
    # 'plain':普通图例。缺省就是普通图例。
    # 'scroll':可滚动翻页的图例。当图例数量较多时可以使用。
    type_: Optional[str] = None,
    # 图例选择的模式,控制是否可以通过点击图例改变系列的显示状态。默认开启图例选择,可以设成 false 关闭
    # 除此之外也可以设成 'single' 或者 'multiple' 使用单选或者多选模式。
    selected_mode: Union[str, bool, None] = None,
    # 是否显示图例组件
    is_show: bool = True,
    # 图例组件离容器左侧的距离。
    # left 的值可以是像 20 这样的具体像素值,可以是像 '20%' 这样相对于容器高宽的百分比,
    # 也可以是 'left', 'center', 'right'。
    # 如果 left 的值为'left', 'center', 'right',组件会根据相应的位置自动对齐。
    pos_left: Union[str, Numeric, None] = None,
    # 图例组件离容器右侧的距离。
    # right 的值可以是像 20 这样的具体像素值,可以是像 '20%' 这样相对于容器高宽的百分比。
    pos_right: Union[str, Numeric, None] = None,
    # 图例组件离容器上侧的距离。
    # top 的值可以是像 20 这样的具体像素值,可以是像 '20%' 这样相对于容器高宽的百分比,
    # 也可以是 'top', 'middle', 'bottom'。
    # 如果 top 的值为'top', 'middle', 'bottom',组件会根据相应的位置自动对齐。
    pos_top: Union[str, Numeric, None] = None,
    # 图例组件离容器下侧的距离。
    # bottom 的值可以是像 20 这样的具体像素值,可以是像 '20%' 这样相对于容器高宽的百分比。
    pos_bottom: Union[str, Numeric, None] = None,
    # 图例列表的布局朝向。可选:'horizontal', 'vertical'
    orient: Optional[str] = None,
    # 图例标记和文本的对齐。默认自动(auto)
    # 根据组件的位置和 orient 决定
    # 当组件的 left 值为 'right' 以及纵向布局(orient 为 'vertical')的时候为右对齐,即为 'right'。
    # 可选参数: `auto`, `left`, `right`
    align: Optional[str] = None,
    # 图例内边距,单位px,默认各方向内边距为5
    padding: int = 5,
    # 图例每项之间的间隔。横向布局时为水平间隔,纵向布局时为纵向间隔。
    # 默认间隔为 10
    item_gap: int = 10,
    # 图例标记的图形宽度。默认宽度为 25
    item_width: int = 25,
    # 图例标记的图形高度。默认高度为 14
    item_height: int = 14,
    # 图例关闭时的颜色。默认是 #ccc
    inactive_color: Optional[str] = None,
    # 图例组件字体样式,参考 `series_options.TextStyleOpts`
    textstyle_opts: Union[TextStyleOpts, dict, None] = None,
    # 图例项的 icon。
    # ECharts 提供的标记类型包括 'circle', 'rect', 'roundRect', 'triangle', 'diamond', 'pin', 'arrow', 'none'
    # 可以通过 'image://url' 设置为图片,其中 URL 为图片的链接,或者 dataURI。
    # 可以通过 'path://' 将图标设置为任意的矢量路径。
    legend_icon: Optional[str] = None,
)
1. 默认参数实例
以下两段代码效果一样:
代码1:
data = [['可乐', 79],
 ['雪碧', 51],
 ['橙汁', 123],
 ['绿茶', 118],
 ['奶茶', 139],
 ['百威', 46],
 ['青岛', 104]]
p1 = (
    Pie()
    .add("", data)
    .set_global_opts(title_opts=opts.TitleOpts(title="Legend-默认设置"))
    .set_series_opts(label_opts=opts.LabelOpts(formatter="{b}: {c}"))
)
代码2:
p2 = (
   Pie()
      .add(series_name='', data_pair=data)
      .set_series_opts(label_opts=opts.LabelOpts(formatter="{b}: {c}"))
      .set_global_opts(
       title_opts=opts.TitleOpts(title="Legend-默认设置"),
       legend_opts=opts.LegendOpts(
           type_='plain',
           selected_mode=True,
           is_show=True,
           pos_left=None,
           pos_right=None,
           pos_top=None,
           pos_bottom=None,
           orient='horizontal',
           align='auto',
           padding=5,
           item_gap=10,
           item_width=25,
           item_height=14,
           inactive_color='#ccc',
           textstyle_opts=None,
           legend_icon=None
      )
  )
)
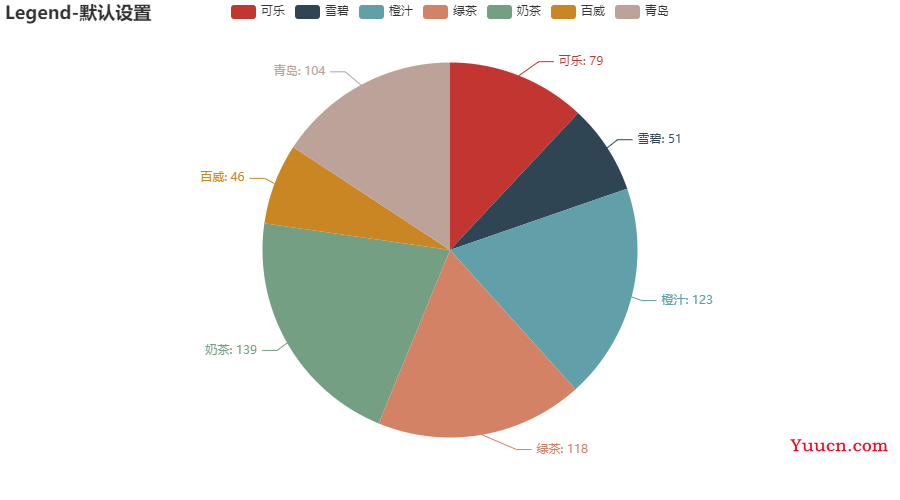
图例默认在 上方居中横排 显示:

2. 设置参数实例
- type_ :'scroll’可滚动翻页的图例,当图例数量较多时使用,默认是 ‘plain’。
- pos_left、pos_right、pos_top、pos_bottom :图例组件离容器边缘距离,一般设置两个即可。
- orient :图例列表的布局,水平-‘horizontal’,垂直-‘vertical’。
- inactive_color :点击图例关闭时的颜色。
- legend_icon :图例项的 icon。‘circle’(圆), ‘rect’(矩形), ‘roundRect’(圆角矩形), ‘triangle’(三角形), ‘diamond’(菱形), ‘pin’(大圆饼), ‘arrow’(箭头)。
p2 = (
   Pie()
      .add(series_name='', data_pair=data)
      .set_series_opts(label_opts=opts.LabelOpts(formatter="{b}: {c}"))
      .set_global_opts(
       title_opts=opts.TitleOpts(title="Legend-设置示例"),
       legend_opts=opts.LegendOpts(
           type_='scroll',
           selected_mode='multiple',
           is_show=True,
           pos_left='',
           pos_right='10%',
           pos_top='20%',
           pos_bottom='',
           orient='vertical',
           align='left',
           padding=5,
           item_gap=20,
           item_width=15,
           item_height=15,
           inactive_color='blue',
           legend_icon='circle'
      )
  )
)
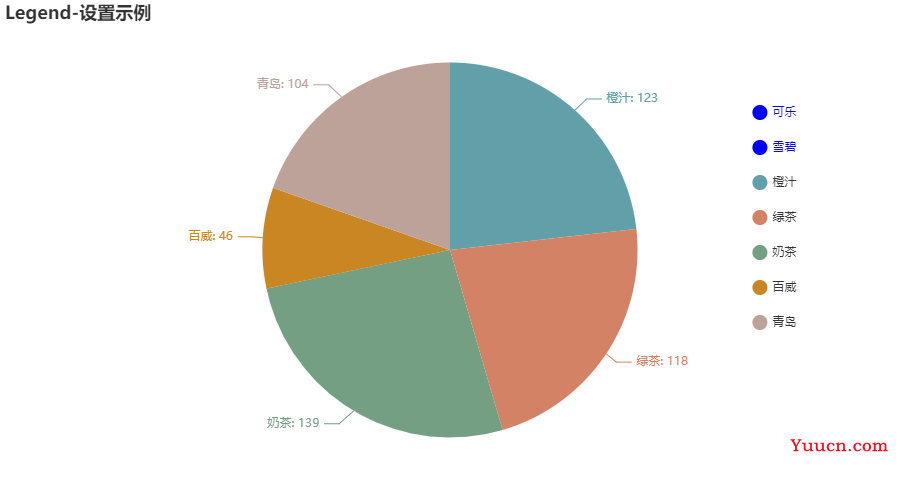
效果:

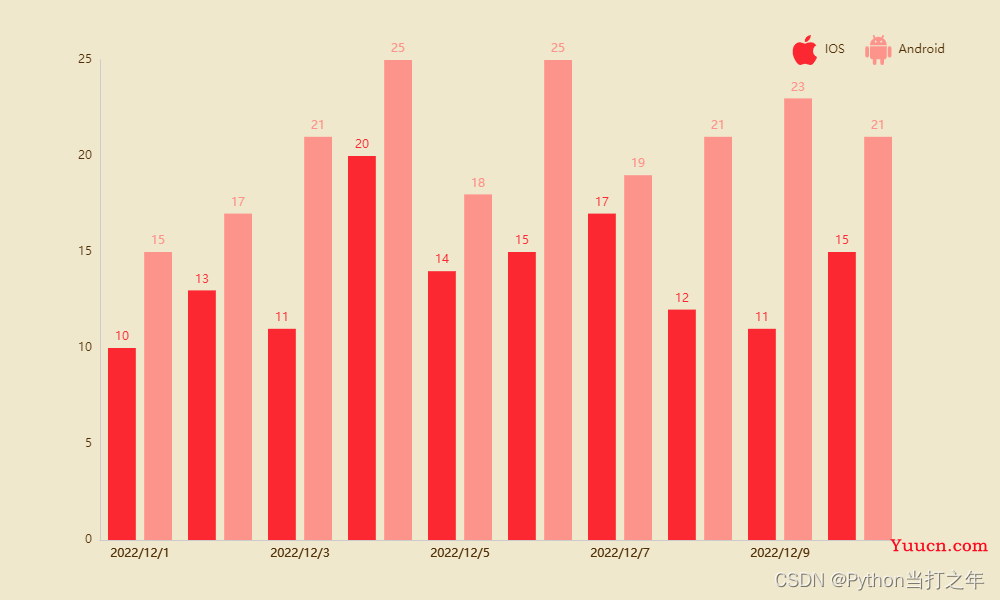
提供两个legend_icon :
ios_icon = 'path://M24.734 17.003c-0.040-4.053 3.305-5.996 3.454-6.093-1.88-2.751-4.808-3.127-5.851-3.171-2.492-0.252-4.862 1.467-6.127 1.467-1.261 0-3.213-1.43-5.28-1.392-2.716 0.040-5.221 1.579-6.619 4.012-2.822 4.897-0.723 12.151 2.028 16.123 1.344 1.944 2.947 4.127 5.051 4.049 2.026-0.081 2.793-1.311 5.242-1.311s3.138 1.311 5.283 1.271c2.18-0.041 3.562-1.981 4.897-3.931 1.543-2.255 2.179-4.439 2.216-4.551-0.048-0.022-4.252-1.632-4.294-6.473zM20.705 5.11c1.117-1.355 1.871-3.235 1.665-5.11-1.609 0.066-3.559 1.072-4.713 2.423-1.036 1.199-1.942 3.113-1.699 4.951 1.796 0.14 3.629-0.913 4.747-2.264z'
android_icon = 'path://M28 12c-1.1 0-2 0.9-2 2v8c0 1.1 0.9 2 2 2s2-0.9 2-2v-8c0-1.1-0.9-2-2-2zM4 12c-1.1 0-2 0.9-2 2v8c0 1.1 0.9 2 2 2s2-0.9 2-2v-8c0-1.1-0.9-2-2-2zM7 23c0 1.657 1.343 3 3 3v0 4c0 1.1 0.9 2 2 2s2-0.9 2-2v-4h4v4c0 1.1 0.9 2 2 2s2-0.9 2-2v-4c1.657 0 3-1.343 3-3v-11h-18v11zM24.944 10c-0.304-2.746-1.844-5.119-4.051-6.551l1.001-2.001c0.247-0.494 0.047-1.095-0.447-1.342s-1.095-0.047-1.342 0.447l-1.004 2.009-0.261-0.104c-0.893-0.297-1.848-0.458-2.84-0.458s-1.947 0.161-2.84 0.458l-0.261 0.104-1.004-2.009c-0.247-0.494-0.848-0.694-1.342-0.447s-0.694 0.848-0.447 1.342l1.001 2.001c-2.207 1.433-3.747 3.805-4.051 6.551v1h17.944v-1h-0.056zM13 8c-0.552 0-1-0.448-1-1s0.447-0.999 0.998-1c0.001 0 0.002 0 0.003 0s0.001-0 0.002-0c0.551 0.001 0.998 0.448 0.998 1s-0.448 1-1 1zM19 8c-0.552 0-1-0.448-1-1s0.446-0.999 0.998-1c0 0 0.001 0 0.002 0s0.002-0 0.003-0c0.551 0.001 0.998 0.448 0.998 1s-0.448 1-1 1z'

大家可以尝试修改各个参数,对比前后效果,加深理解。
🏳️🌈 更多设置实例(源码+数据下载)
👉【源码下载 | Python可视化系列文章资源(源码+数据)】
以上就是本期为大家整理的全部内容了,赶快练习起来吧,原创不易,喜欢的朋友可以点赞、收藏也可以分享(注明出处)让更多人知道。