1.决策树的构造
1.1优缺点
优点:
-
计算复杂度不高:以ID3为例,每次运算都是基于某一列特征,特征计算完后,下次计算不考虑该最有特征,并且通过适当剪枝可以简化复杂度
-
输出结果易于理解:因为输出的是一个树的结构,树的走向一目了然
-
对中间值的缺失不敏感
-
可以处理不相关特 征数据:是基于每列特征来计算,不考虑特征之间的依赖关系
缺点:可能会产生过度匹配问题。
适用数据类型:数值型和标称型。
1.2信息熵
主要用来度量信息的混乱程度,信息越混乱,说明能够包含的信息量越多,则熵越大。反之若信息越有序说明包含的信息量越少,则熵越小。
1.3信息增益
标准的说法就是:一个随机变量的引入导致了另一个随机变量的混乱性变化(约束),如果约束越大,信息增益就越大。举个通俗易懂的例子就是:比如你去银行贷款,如果你自己的个人信息你对贷款员什么都不说,那贷款员是不是就很不确定是否贷款给你,如果你只说了你的薪资,那较之前相比,贷款员是否给你贷款是不是就多了一种判断的依据,也就是说,你告诉贷款员你的个人信息越多,贷款员是否给你贷款就越确定,此时的信息增益也就是最大。在举一个例子:了解一个人的信息,如果给一个身份证号,由于每个人的身份证号都是唯一的,所以一个身份证号就可以判断这个的所有信息,也就是引入身份证号这个属性之后,就会唯一确定一个人,这时身份证号对判断这个人的约束是最大,信息增益也就是最大。
2.决策树的构造
2.1熵的计算
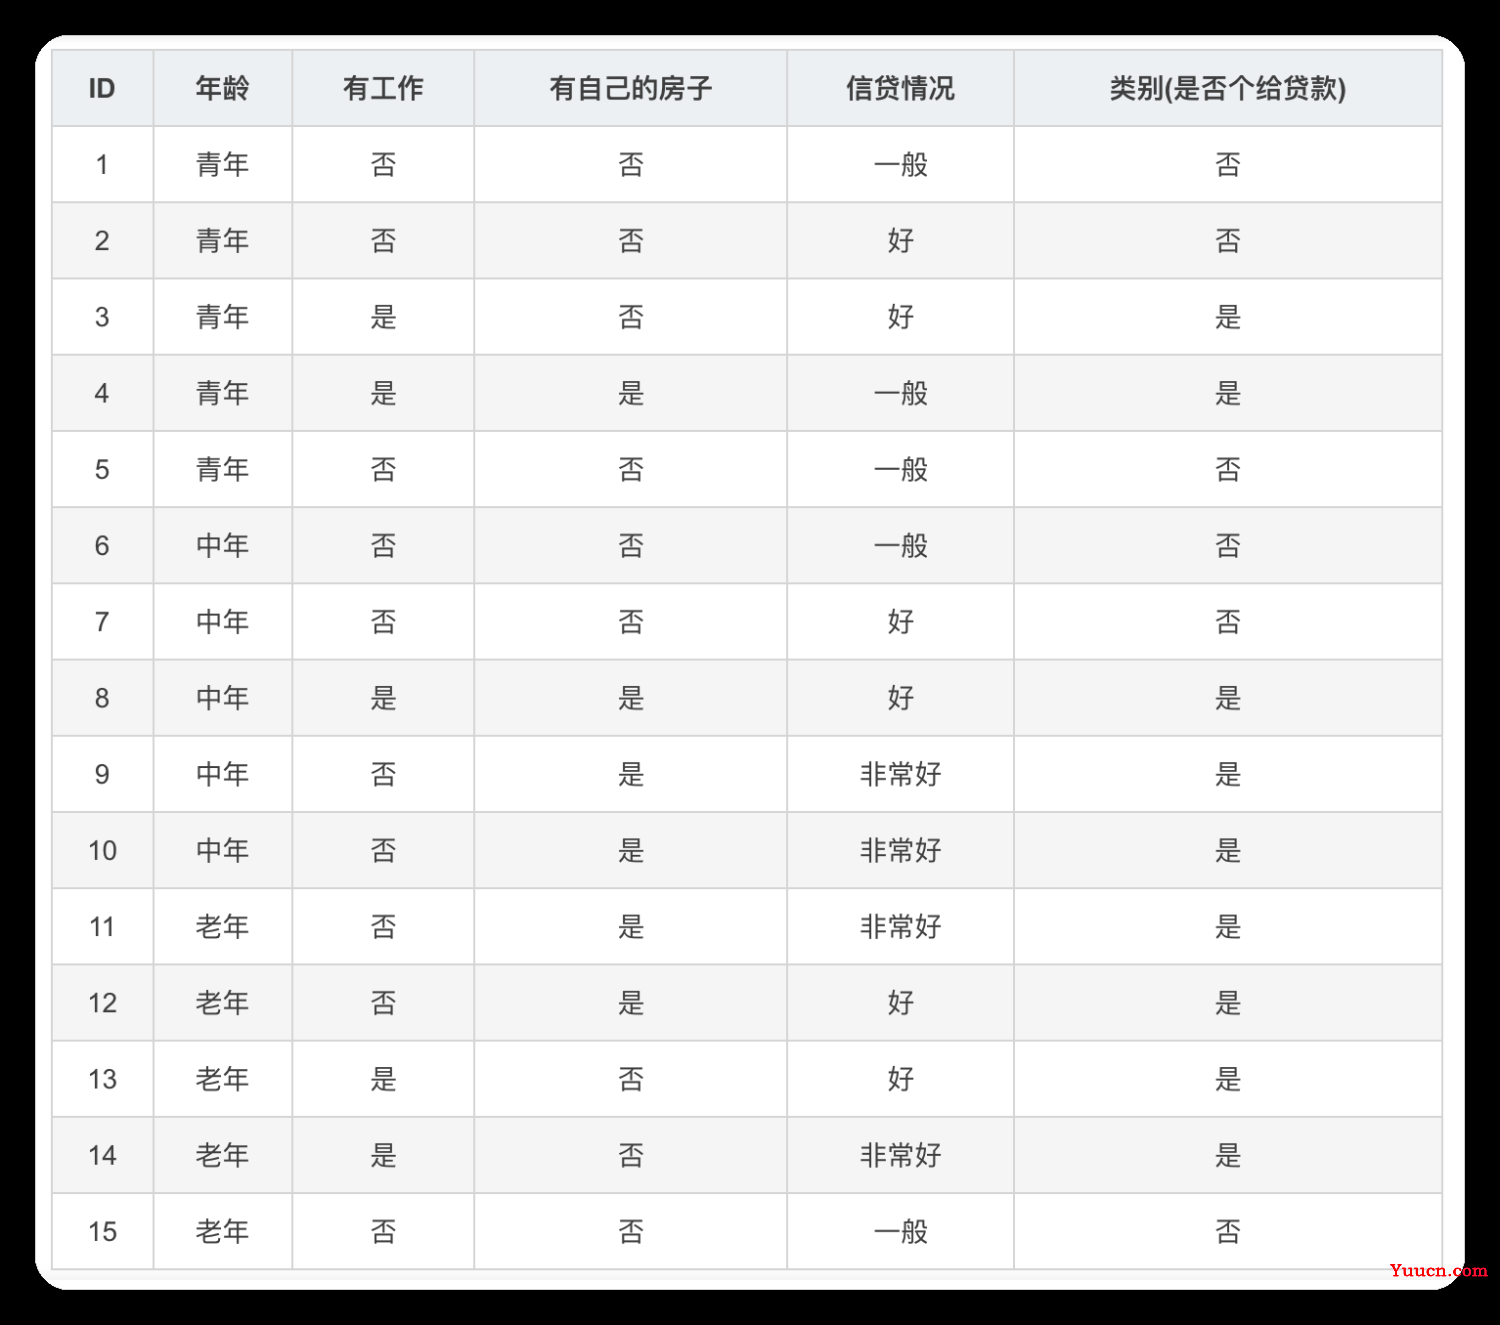
数据集:

根据表中的数据统计可知,在15个数据中,9个数据的结果为放贷,6个数据的结果为不放贷。所以数据集D的经验熵H(D)为:

def calcShannonEnt(dataSet):
    numEntires = len(dataSet)    #返回数据集的行数
    labelCounts = {}    #保存每个标签(Label)出现次数的字典
    for featVec in dataSet: #featVec代表一行一行的数据   #对每组特征向量进行统计
        currentLabel = featVec[-1]  #取每一行的最后一列也即是否贷款的值
        if currentLabel not in labelCounts.keys():    #如果标签(Label)没有放入统计次数的字典,添加进去
            labelCounts[currentLabel] = 0#键对应的值设为零
        labelCounts[currentLabel] += 1 #键对应的值加一
    shannonEnt = 0.0                                #经验熵(香农熵)
    for key in labelCounts:                            #计算香农熵
        prob = float(labelCounts[key]) / numEntires    #选择该标签(Label)的概率
        shannonEnt -= prob * log(prob, 2)            #利用公式计算
    return shannonEnt
def createDataSet():
    #年龄:0代表青年,1代表中年,2代表老年
    #信贷情况:0代表一般,1代表好,2代表非常好
    dataSet = [[0, 0, 0, 0, 'no'],  # 数据集
               [0, 0, 0, 1, 'no'],
               [0, 1, 0, 1, 'yes'],
               [0, 1, 1, 0, 'yes'],
               [0, 0, 0, 0, 'no'],
               [1, 0, 0, 0, 'no'],
               [1, 0, 0, 1, 'no'],
               [1, 1, 1, 1, 'yes'],
               [1, 0, 1, 2, 'yes'],
               [1, 0, 1, 2, 'yes'],
               [2, 0, 1, 2, 'yes'],
               [2, 0, 1, 1, 'yes'],
               [2, 1, 0, 1, 'yes'],
               [2, 1, 0, 2, 'yes'],
               [2, 0, 0, 0, 'no']]
    labels = ['年龄', '有工作', '有自己的房子', '信贷情况']  # 特征标签
    return dataSet, labels  # 返回数据集和分类属性
myDat,labels=createDataSet()
print(myDat)
print(calcShannonEnt(myDat))
测试结果:

2.2划分数据集
2.2.1按照给定特征划分数据集
#三个输入参数:待划分的数据集、划分数据集的特征、需要返回的特征的值
def splitDataSet(dataSet, axis, value):
    retDataSet = []                 #创建返回的数据集列表
    for featVec in dataSet:             #遍历数据集
        if featVec[axis] == value:
            reducedFeatVec = featVec[:axis]    #去掉axis特征
            reducedFeatVec.extend(featVec[axis+1:])     #将符合条件的添加到返回的数据集
            retDataSet.append(reducedFeatVec)
    return retDataSet        #返回划分后的数据集
上面代码的解释,假设axis=0,value=1,表示的是在第一列年龄的属性中,找到值为1(也即为中年)的所有行,然后去掉每一行中第一列的数据(其实很多余,因为在算熵的时候只取最后一列的数据),然后每一行的剩余列的数据保存
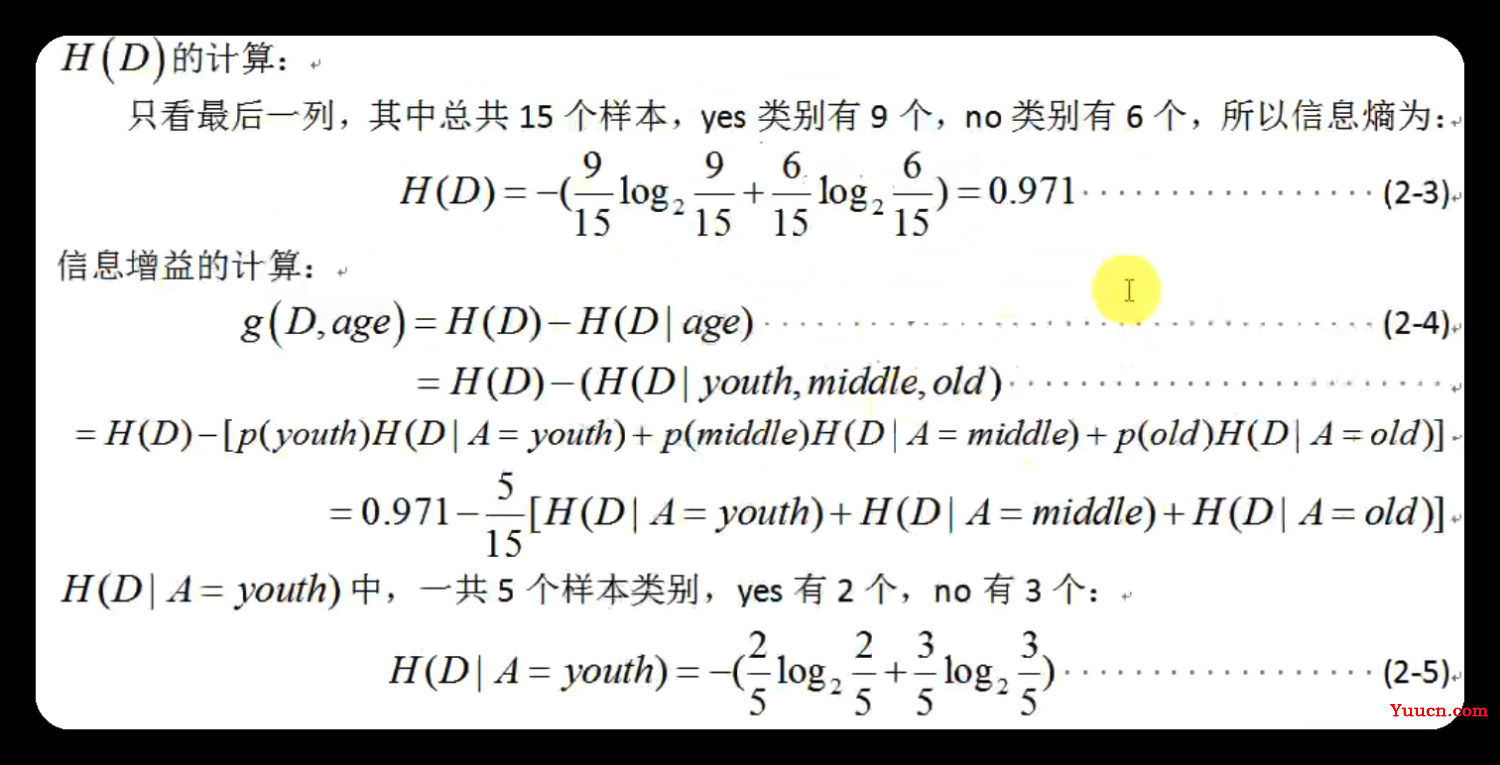
以添加年龄之后算此时是否贷款的信息增益的方法如下图:

2.2.2选择最好的数据集划分方式
代码实现:
def chooseBestFeatureToSplit(dataSet):
    numFeatures = len(dataSet[0]) - 1    #特征数量
    baseEntropy = calcShannonEnt(dataSet)                 #计算数据集的香农熵
    bestInfoGain = 0.0      #信息增益
    bestFeature = -1       #最优特征的索引值
    for i in range(numFeatures):   #遍历所有特征
        #获取dataSet的第i个所有特征-第i列全部的值
        featList = [example[i] for example in dataSet]
        uniqueVals = set(featList)   #创建set集合{},元素不可重复
        newEntropy = 0.0   #经验条件熵
        for value in uniqueVals:  #计算信息增益
            subDataSet = splitDataSet(dataSet, i, value) #subDataSet划分后的子集
            prob = len(subDataSet) / float(len(dataSet)) #计算子集的概率如上图的p(youth),p(middle),p(old)的值
            newEntropy += prob * calcShannonEnt(subDataSet)     #根据公式计算经验条件熵
        infoGain = baseEntropy - newEntropy #信息增益=h(D)-h(D|A)
        # print("第%d个特征的增益为%.3f" % (i, infoGain))            #打印每个特征的信息增益
        if (infoGain > bestInfoGain): #取出信息增益的最大值                            #计算信息增益
            bestInfoGain = infoGain                             #更新信息增益,找到最大的信息增益
            bestFeature = i                                     #记录信息增益最大的特征的索引值
    return bestFeature
2.3递归构建决策树
#当所有的特征及属性都遍历完成之后任然不能确定是否贷款
#此时可根据classlist中是否贷款各自的数量,取最大票数的即可
def majorityCnt(classList):
    classCount = {}
    for vote in classList:                                        #统计classList中每个元素出现的次数
        if vote not in classCount.keys():
            classCount[vote] = 0
        classCount[vote] += 1
    sortedClassCount = sorted(classCount.items(), key = operator.itemgetter(1), reverse = True) #根据字典的值降序排序
    return sortedClassCount[0][0]                                #返回classList中出现次数最多的元素
#创建树的函数代码
def createTree(dataSet, labels):
    classList = [example[-1] for example in dataSet]#取分类标签(是否放贷:yes or no)
    # print("classlist:")
    # print(classList)
    if classList.count(classList[0]) == len(classList):            #如果类别完全相同则停止继续划分
        return classList[0]
    if len(dataSet[0]) == 1: #遍历完所有特征时返回出现次数最多的类标签
        return majorityCnt(classList)
    bestFeat = chooseBestFeatureToSplit(dataSet) #选择最优特征
    bestFeatLabel = labels[bestFeat]#最优特征的标签
    #featLabels.append(bestFeatLabel)
    myTree = {bestFeatLabel:{}}#根据最优特征的标签生成树
    del(labels[bestFeat])    #删除已经使用特征标签
    featValues = [example[bestFeat] for example in dataSet]  #得到训练集中所有最优特征的属性值
    uniqueVals = set(featValues) #去掉重复的属性值
    for value in uniqueVals:   #遍历特征,创建决策树。
       subLabels=labels[:]
       myTree[bestFeatLabel][value] = createTree(splitDataSet(dataSet, bestFeat, value), subLabels)
    return myTree
递归函数的第一个停止条件是所有的
类标签完全相同,则直接返回该类标签。递归函数的第二个停止条件是使用完了所有特征,任然不能将数据集划分成仅包含唯一类别的分组 。由于第二个条件无法简单地返回唯一的类标 签,这里使用投票表决的函数挑选出现次数最多的类别作为返回值
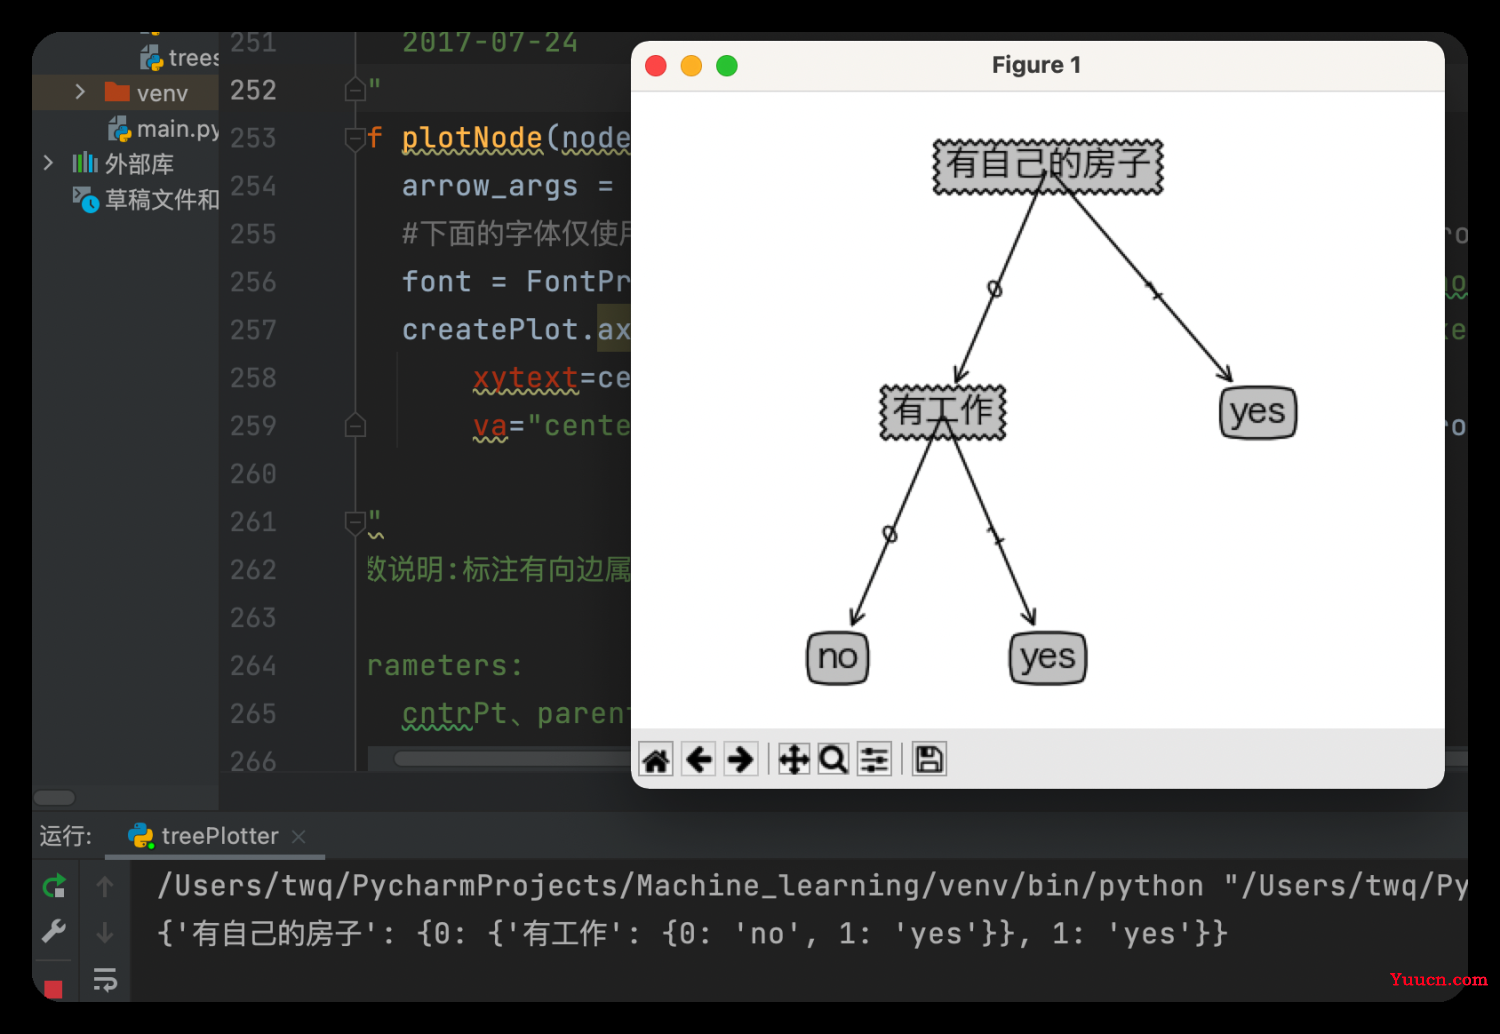
运行结果

由上面建立的决策树可知,首先判断你是否有房子,如果有就可以贷款给你,如果没有房子再看你是否有工作,如果既没有房子也没有工作,就不贷款给你,如果有没有房子,但有工作,也贷款给你
3.使用 Matplotlib 注解绘制树形图
使用Matplotlib的注解功能绘制树形图,它可以对文字着色并提供多种形状以供选择, 而且我们还可以反转箭头,将它指向文本框而不是数据点。
#获取决策树叶子结点的数目
def getNumLeafs(myTree):
    numLeafs = 0 #初始化叶子
    firstStr = next(iter(myTree)) #python3中myTree.keys()返回的是dict_keys,不在是list,所以不能使用myTree.keys()[0]的方法获取结点属性,可以使用list(myTree.keys())[0]
    secondDict = myTree[firstStr] #获取下一组字典
    for key in secondDict.keys():
        if type(secondDict[key]).__name__=='dict': #测试该结点是否为字典,如果不是字典,代表此结点为叶子结点
            numLeafs += getNumLeafs(secondDict[key])
        else:   numLeafs +=1
    return numLeafs
#获取决策树的层数
def getTreeDepth(myTree):
    maxDepth = 0  #初始化决策树深度
    firstStr = next(iter(myTree)) #python3中myTree.keys()返回的是dict_keys,不在是list,所以不能使用myTree.keys()[0]的方法获取结点属性,可以使用list(myTree.keys())[0]
    secondDict = myTree[firstStr] #获取下一个字典
    for key in secondDict.keys():
        if type(secondDict[key]).__name__=='dict': #测试该结点是否为字典,如果不是字典,代表此结点为叶子结点
            thisDepth = 1 + getTreeDepth(secondDict[key])
        else:   thisDepth = 1
        if thisDepth > maxDepth: maxDepth = thisDepth #更新层数
    return maxDepth
#绘制结点
def plotNode(nodeTxt, centerPt, parentPt, nodeType):
    arrow_args = dict(arrowstyle="<-")  #定义箭头格式
    #下面的字体仅使用与Mac用户,如果您是Windows用户请修改为font = FontProperties(fname=r"c:\windows\fonts\simsun.ttc", size=14)
    font = FontProperties(fname=r'/System/Library/Fonts/Hiragino Sans GB.ttc', size=14)        #设置中文字体
    createPlot.ax1.annotate(nodeTxt, xy=parentPt,  xycoords='axes fraction',    #绘制结点
        xytext=centerPt, textcoords='axes fraction',
        va="center", ha="center", bbox=nodeType, arrowprops=arrow_args, fontproperties=font)
#标注有向边属性值
def plotMidText(cntrPt, parentPt, txtString):
    xMid = (parentPt[0]-cntrPt[0])/2.0 + cntrPt[0]                                            #计算标注位置
    yMid = (parentPt[1]-cntrPt[1])/2.0 + cntrPt[1]
    createPlot.ax1.text(xMid, yMid, txtString, va="center", ha="center", rotation=30)
#绘制决策树
def plotTree(myTree, parentPt, nodeTxt):
    decisionNode = dict(boxstyle="sawtooth", fc="0.8")      #设置结点格式
    leafNode = dict(boxstyle="round4", fc="0.8")     #设置叶结点格式
    numLeafs = getNumLeafs(myTree)       #获取决策树叶结点数目,决定了树的宽度
    depth = getTreeDepth(myTree)       #获取决策树层数
    firstStr = next(iter(myTree))         #下个字典
    cntrPt = (plotTree.xOff + (1.0 + float(numLeafs))/2.0/plotTree.totalW, plotTree.yOff)    #中心位置
    plotMidText(cntrPt, parentPt, nodeTxt)       #标注有向边属性值
    plotNode(firstStr, cntrPt, parentPt, decisionNode)       #绘制结点
    secondDict = myTree[firstStr]         #下一个字典,也就是继续绘制子结点
    plotTree.yOff = plotTree.yOff - 1.0/plotTree.totalD      #y偏移
    for key in secondDict.keys():
        if type(secondDict[key]).__name__=='dict':   #测试该结点是否为字典,如果不是字典,代表此结点为叶子结点
            plotTree(secondDict[key],cntrPt,str(key))    #不是叶结点,递归调用继续绘制
        else:          #如果是叶结点,绘制叶结点,并标注有向边属性值
            plotTree.xOff = plotTree.xOff + 1.0/plotTree.totalW
            plotNode(secondDict[key], (plotTree.xOff, plotTree.yOff), cntrPt, leafNode)
            plotMidText((plotTree.xOff, plotTree.yOff), cntrPt, str(key))
    plotTree.yOff = plotTree.yOff + 1.0/plotTree.totalD
#创建绘制面板
def createPlot(inTree):
    fig = plt.figure(1, facecolor='white') #创建fig
    fig.clf()   #清空fig
    axprops = dict(xticks=[], yticks=[])
    createPlot.ax1 = plt.subplot(111, frameon=False, **axprops) #去掉x、y轴
    plotTree.totalW = float(getNumLeafs(inTree)) #获取决策树叶结点数目
    plotTree.totalD = float(getTreeDepth(inTree)) #获取决策树层数
    plotTree.xOff = -0.5/plotTree.totalW; plotTree.yOff = 1.0; #x偏移
    plotTree(inTree, (0.5,1.0), '')  #绘制决策树
    plt.show()  #显示绘制结果
if __name__ == '__main__':
    dataSet, labels = createDataSet()
    #featLabels = []
    myTree = createTree(dataSet, labels)
    print(myTree)
    createPlot(myTree)
运行遇到的错误:
-
1.AttributeError:module 'backend_interagg' has no attribute 'FigureCanvas'
解决方法:
在pycharm中打开" File --> Settings --> Tools --> Python Scientific ",将"Show plots in toolwindow"去掉勾选,并应用。 -
2.'Annotation' object has no property 'FontProperties'
解决方法:
找了一会发现是字体问题,因为我的电脑是Mac系统,在字体设置与Windows有些区别,读者可以根据如下步骤修改:首先在终端输入open /System/Library/Fonts然后找到一种字体,并复制其路径,另外在调用的时候FontProperties要写成小写,否则也会报错,如下图
最终问题解决之后,运行结果如下图

3.使用决策树预测隐形眼镜类型
数据源
young	myope	no	reduced	no lenses
young	myope	no	normal	soft
young	myope	yes	reduced	no lenses
young	myope	yes	normal	hard
young	hyper	no	reduced	no lenses
young	hyper	no	normal	soft
young	hyper	yes	reduced	no lenses
young	hyper	yes	normal	hard
pre	myope	no	reduced	no lenses
pre	myope	no	normal	soft
pre	myope	yes	reduced	no lenses
pre	myope	yes	normal	hard
pre	hyper	no	reduced	no lenses
pre	hyper	no	normal	soft
pre	hyper	yes	reduced	no lenses
pre	hyper	yes	normal	no lenses
presbyopic	myope	no	reduced	no lenses
presbyopic	myope	no	normal	no lenses
presbyopic	myope	yes	reduced	no lenses
presbyopic	myope	yes	normal	hard
presbyopic	hyper	no	reduced	no lenses
presbyopic	hyper	no	normal	soft
presbyopic	hyper	yes	reduced	no lenses
presbyopic	hyper	yes	normal	no lenses
代码实现
import treePlotter#之前写的构建决策树和绘制决策树的代码
if __name__ == '__main__':
    fr = open('lenses.txt')
    lenses = [inst.strip().split('\t') for inst in fr.readlines()]
    #print(lenses)
    lensesLabels = ['age', 'prescript', 'astigmatic', 'tearRate']
    lensesTree=treePlotter.createTree(lenses,lensesLabels)
    print(lensesTree)
    treePlotter.createPlot(lensesTree)
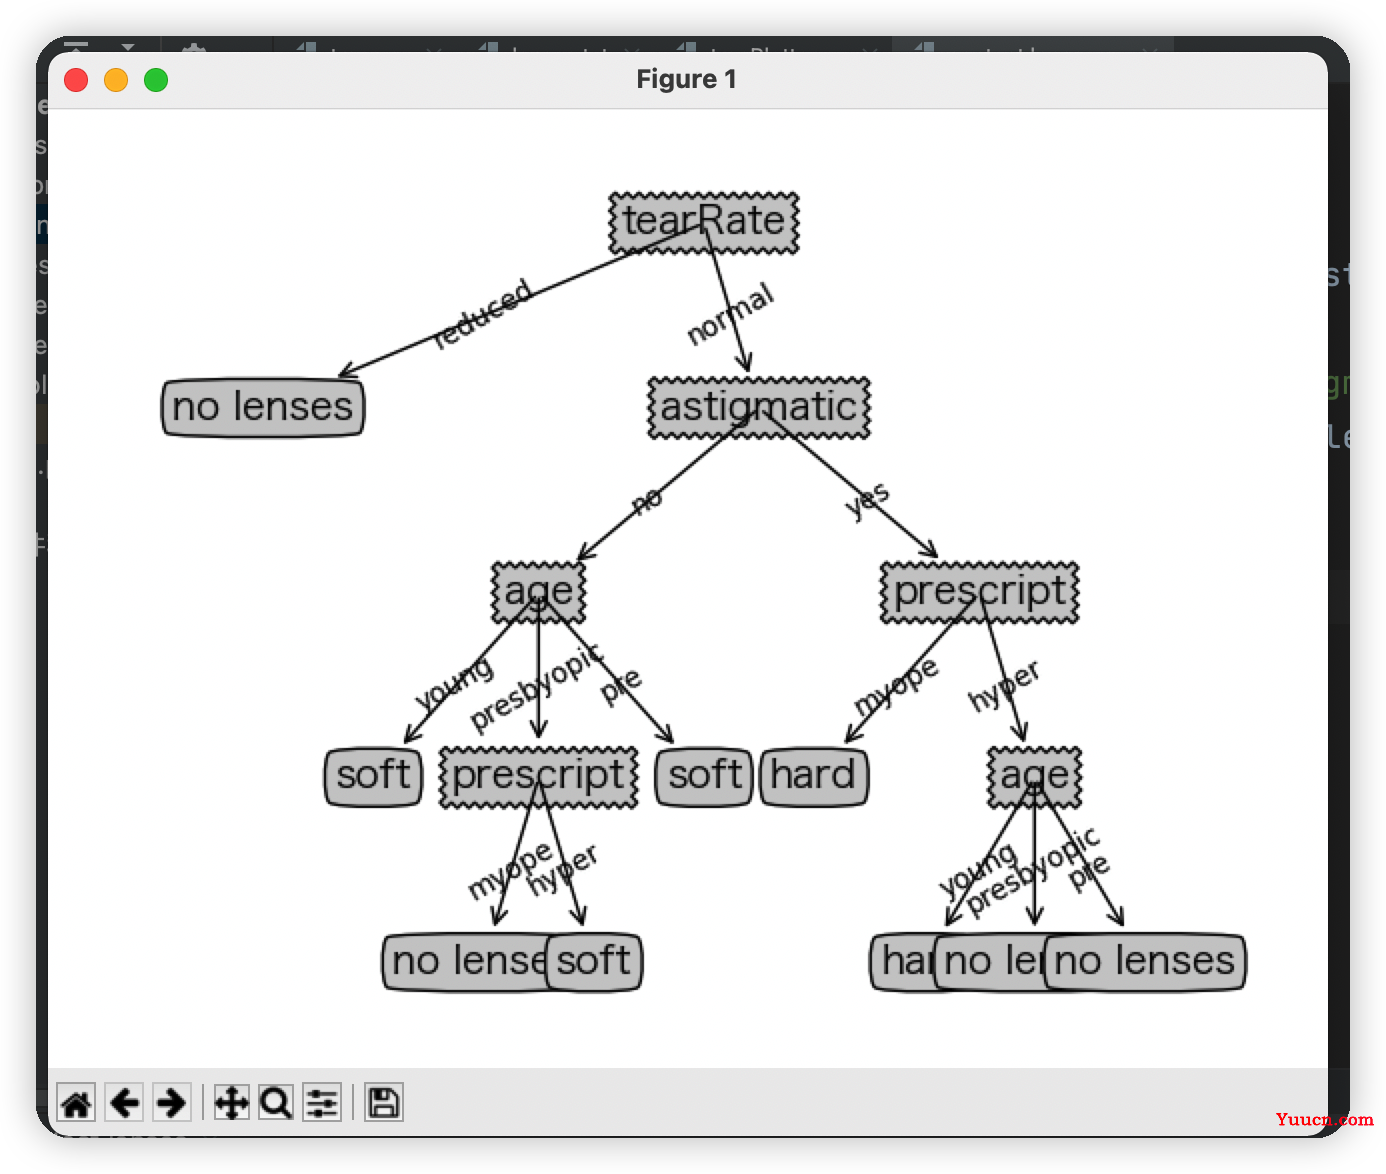
运行结果
